Performance
Javelin aims to provide a pleasant developer experience without sacrificing much in the way of speed. It performs around middle of the pack when compared with other ECS libraries written in JavaScript.
Iteration performance and memory usage are two major concerns of an ECS. This section expands on Javelin's approach to each.
Iteration#
Javelin stores components in objects called archetypes. An archetype contains components of entities that share the exact same composition. An array of archetypes acts as an index that lets a query skip entire swathes of entities that don't match its selector. For example, when querying for entities with components (A, B), we can skip entities of all archetypes that aren't superset of (A, B).
In a simple benchmark of 10 component types, 10 archetypes, and 10 queries, Javelin achieves (at 60Hz):
- ~2.3m iterations per tick on a 2GHz Intel i5 processor (2020 Macbook Pro 13-inch)
- ~4m iterations per tick on a 3.79 GHz AMD processor (Ryzen 3900XT)
You can see how archtypes and queries are implemented in archetype.ts and query.ts, respectively.
Resources#
- Specs and Legion, two very different approaches to ECS by Cora Sherratt
- Building an ECS #2: Archetypes and Vectorization by Sander Mertens
- Memory in Javascript— Beyond Leaks by Yonatan Kra
Memory#
Storage#
In C/C++ ECS implementations, components are typically represented as byte arrays. This lets the CPU optimize loops that iterate components because data is stored sequentially in packed arrays. We have less control over how memory is allocated in a high-level language like JavaScript, although there are examples of TypedArray-based ECS libraries that can achieve very good performance.
In Javelin, components are plain old JavaScript objects. Using regular objects makes Javelin easier to understand for people unfamiliar with vectorization or binary data. It also makes it easier to support complex nested component structures, and makes it trivial to get data in/out of the ECS (e.g. for serialization).
Garbage Collection#
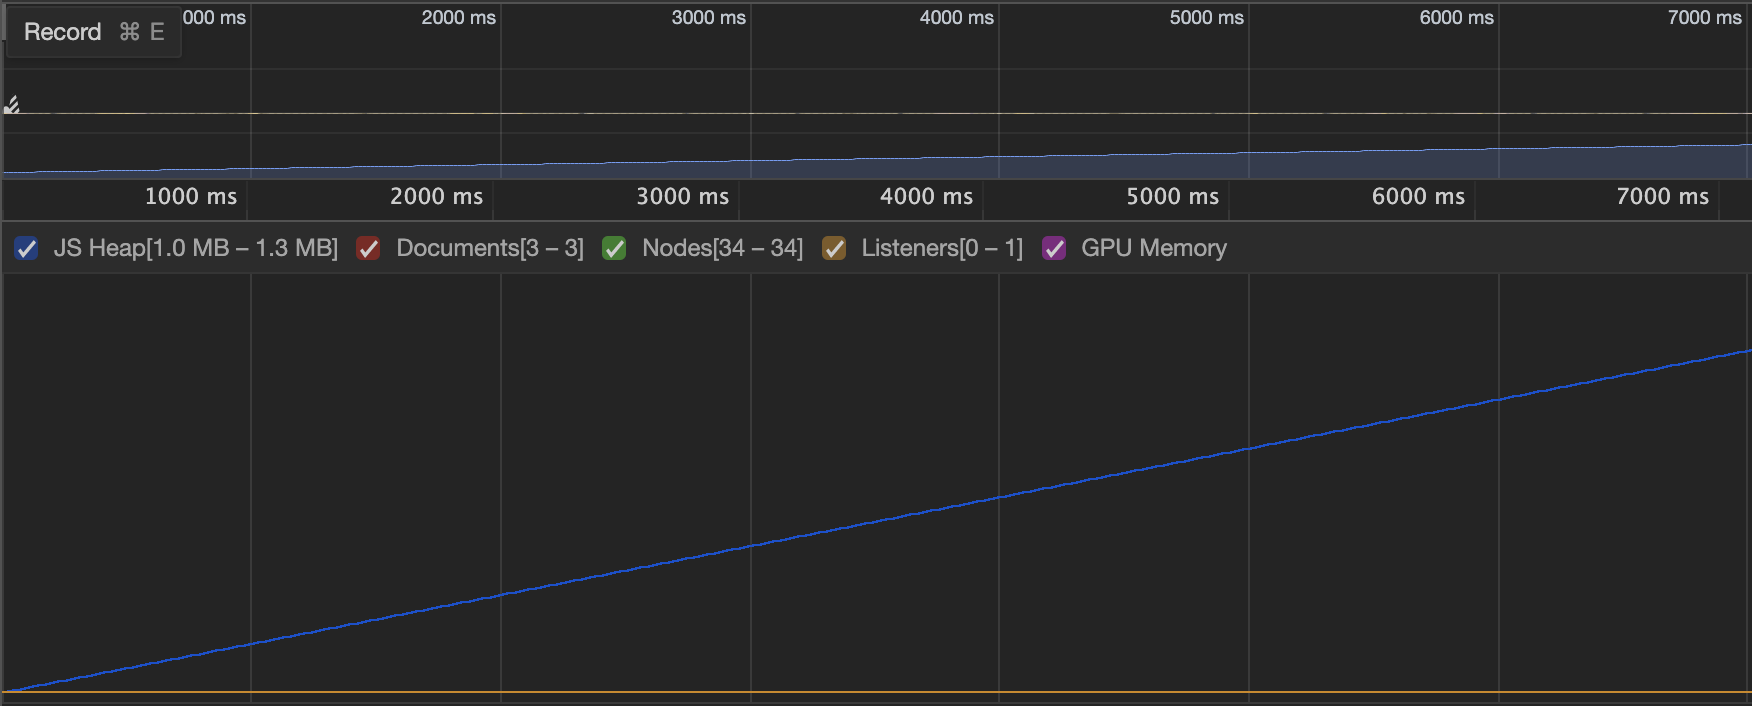
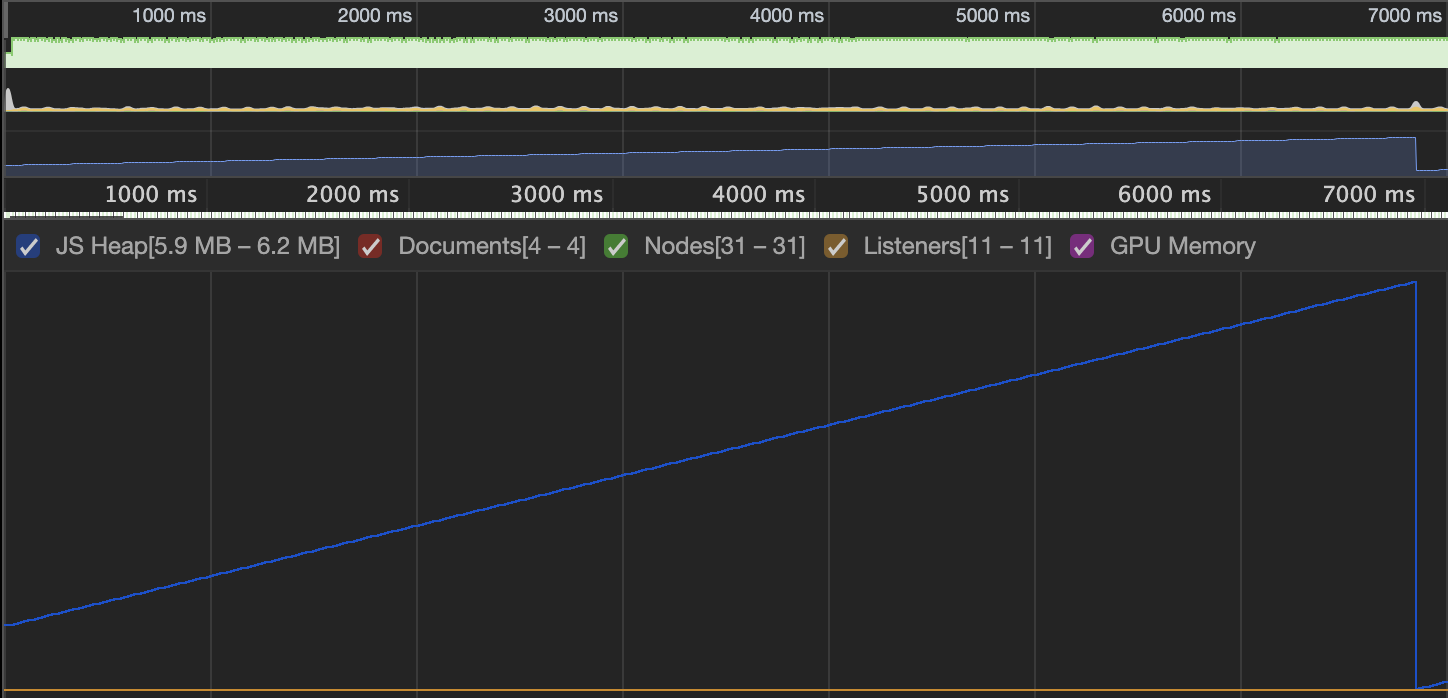
Below is a screenshot of an allocation timeline where 10k entities are iterated by 3 systems per tick at 60Hz. The memory growth (0.3mb) is consistent with standard setInterval or requestAnimationFrame performance and there is no "sawtooth" pattern of frequent, minor GC events.
Simple requestAnimationFrame loop
Simple requestAnimationFrame loop @ 10k entities/tick
Performance Tests#
Run the performance tests by cloning the repository and running yarn perf:
git clone https://github.com/3mcd/javelin
cd javelin
yarn && yarn perf
Example yarn perf output:
========================================
perf
========================================
entity_count         | 1,750,000
component_type_count | 10
query_count          | 10
tick_count           | 1,000
tick_time_avg        | 16.483ms
iters_per_tick       | 2,100,000
iters_total          | 2,100,000,000